Fintech · AI Product · Product Strategy · 2026
Honest numbers
An investment tracker for people who want to invest without first learning to speak finance. I was one of them, which is how the project started.
- Role
- Product: research, definition, design, shipped build
- Team
- Me, working with AI agents
- Method
- AI agents for research, every load bearing claim checked by hand
- Stack
- Next.js · TypeScript · Vercel
It started over lunch
A conversation with friends turned to money, and one of them started asking the questions most people keep to themselves. How do you actually start investing. What is an IPO. How does anyone keep track of what they own.
I didn't have good answers. I'm interested in investing and I am not a finance person. That is what made the problem worth taking seriously. I was inside it, not looking at it from the outside.
Getting money invested is the easy part. Working out whether it is going well is where people are stuck.
Who the problem actually belongs to
One conversation is an anecdote, not a market. It pointed at a much larger group: people curious about investing, put off by the vocabulary, who want to understand what they already hold without becoming an expert first.
31%
of New Zealanders sit in the lowest financial knowledge group.
Te Ara Ahunga Ora Retirement Commission
~50%
of KiwiSaver members read their annual statement. The stated reasons for not reading are being time poor and the reports being too complex.
FMA Consumer Confidence Survey, 2024
60%
spend time researching and comparing investments, mostly through word of mouth, news and banks.
FMA Consumer Confidence Survey, 2024
People will look. They will not do homework to understand what they are looking at. Closing that gap is the product.
That also settled what the app should not be. A meta analysis covering 201 studies found financial literacy interventions explain around 0.1% of the variance in what people go on to do with their money. Teaching people the vocabulary has twenty years of evidence against it. So there is no lessons tab: an explanation only ships if it can be attached to one of the user's own live numbers.
A spreadsheet as the starting reference
To work out what an investor might want to monitor, I started from something real instead of a feature list. An accountant I know had been tracking his own investments weekly and let me pull his workbook apart: five holdings, 49 columns, six months of entries, five different ways of measuring return.
As a list of what to track, it did its job. What made it valuable was everything in it that was wrong.
Column W · week 1 · annualised return
11,862,233%
The same column settles to 28.7% within five weeks, which is why nobody questions it later.
Four of its five annualised return columns were unusable. The fifth, the only stable looking one, was the most wrong of all: a single cell booked two years of contributions as one lump sum, dated two years before they happened. Excel computed it, the error handling didn't catch it, and it was looked at every week for six months without anyone noticing.
Maximum literacy, maximum effort, and still no answer anyone could trust. Someone starting out has neither. That reframed the brief: the problem is not that people lack a tracker, it is that the tools they already have will confidently tell them something false.
Running the research with agents
I ran this the way I'd run a small team, except the team was AI agents: a research agent for problem framing and competitive work, a design pass, a build. My job was briefing, judgment, and the part that turned out to matter most: verification.
The first research pass came back confident, well cited, and framed around the wrong person: the accountant, not the beginner. I rewrote the brief and ran it again. Then I checked its claims against the source material. Several didn't hold.
| Agent reported | Checking showed | Why it mattered |
|---|---|---|
| Two years of weekly tracking | 2 years → 27 weeks | Six months of habit, not two years: a weaker loyalty signal, and a better moment to intervene. |
| One broken return column | 1 of 5 → 4 of 5 | Turned an anecdote into the product thesis. Nearly every number in the reference tool was noise. |
| Bank feeds can supply investment transactions | Confirmed, with a catch | The aggregator exposes transactions for banks but not investment platforms. That single fact reordered onboarding. |
The transferable skill isn't prompting. It's knowing which three claims out of thirty are load bearing, and refusing to build until those three are verified.
Three decisions I changed my mind on
My first rule was a hard refusal: below three months or $500, show nothing. It was principled and too blunt, because it withheld information people could legitimately use. The model now re solves each return against a nudged valuation and reports the spread.
Three densities of the same layout were not distinguishable. If I could not tell the levels apart by looking, no user would. They became three different screens answering three different questions.
Segmenting by financial literacy meant guessing at something people would not want guessed at, and guessing wrong in the direction of condescension. Onboarding now just asks, in plain words. It also says out loud that the choice only changes what sits open by default: every measure stays available on every setting, and you can change it later.
Getting someone in without a finance vocabulary
Onboarding carries most of the risk. Every question is one a person can answer about their own life, and the one question nobody can answer has an explicit way out.
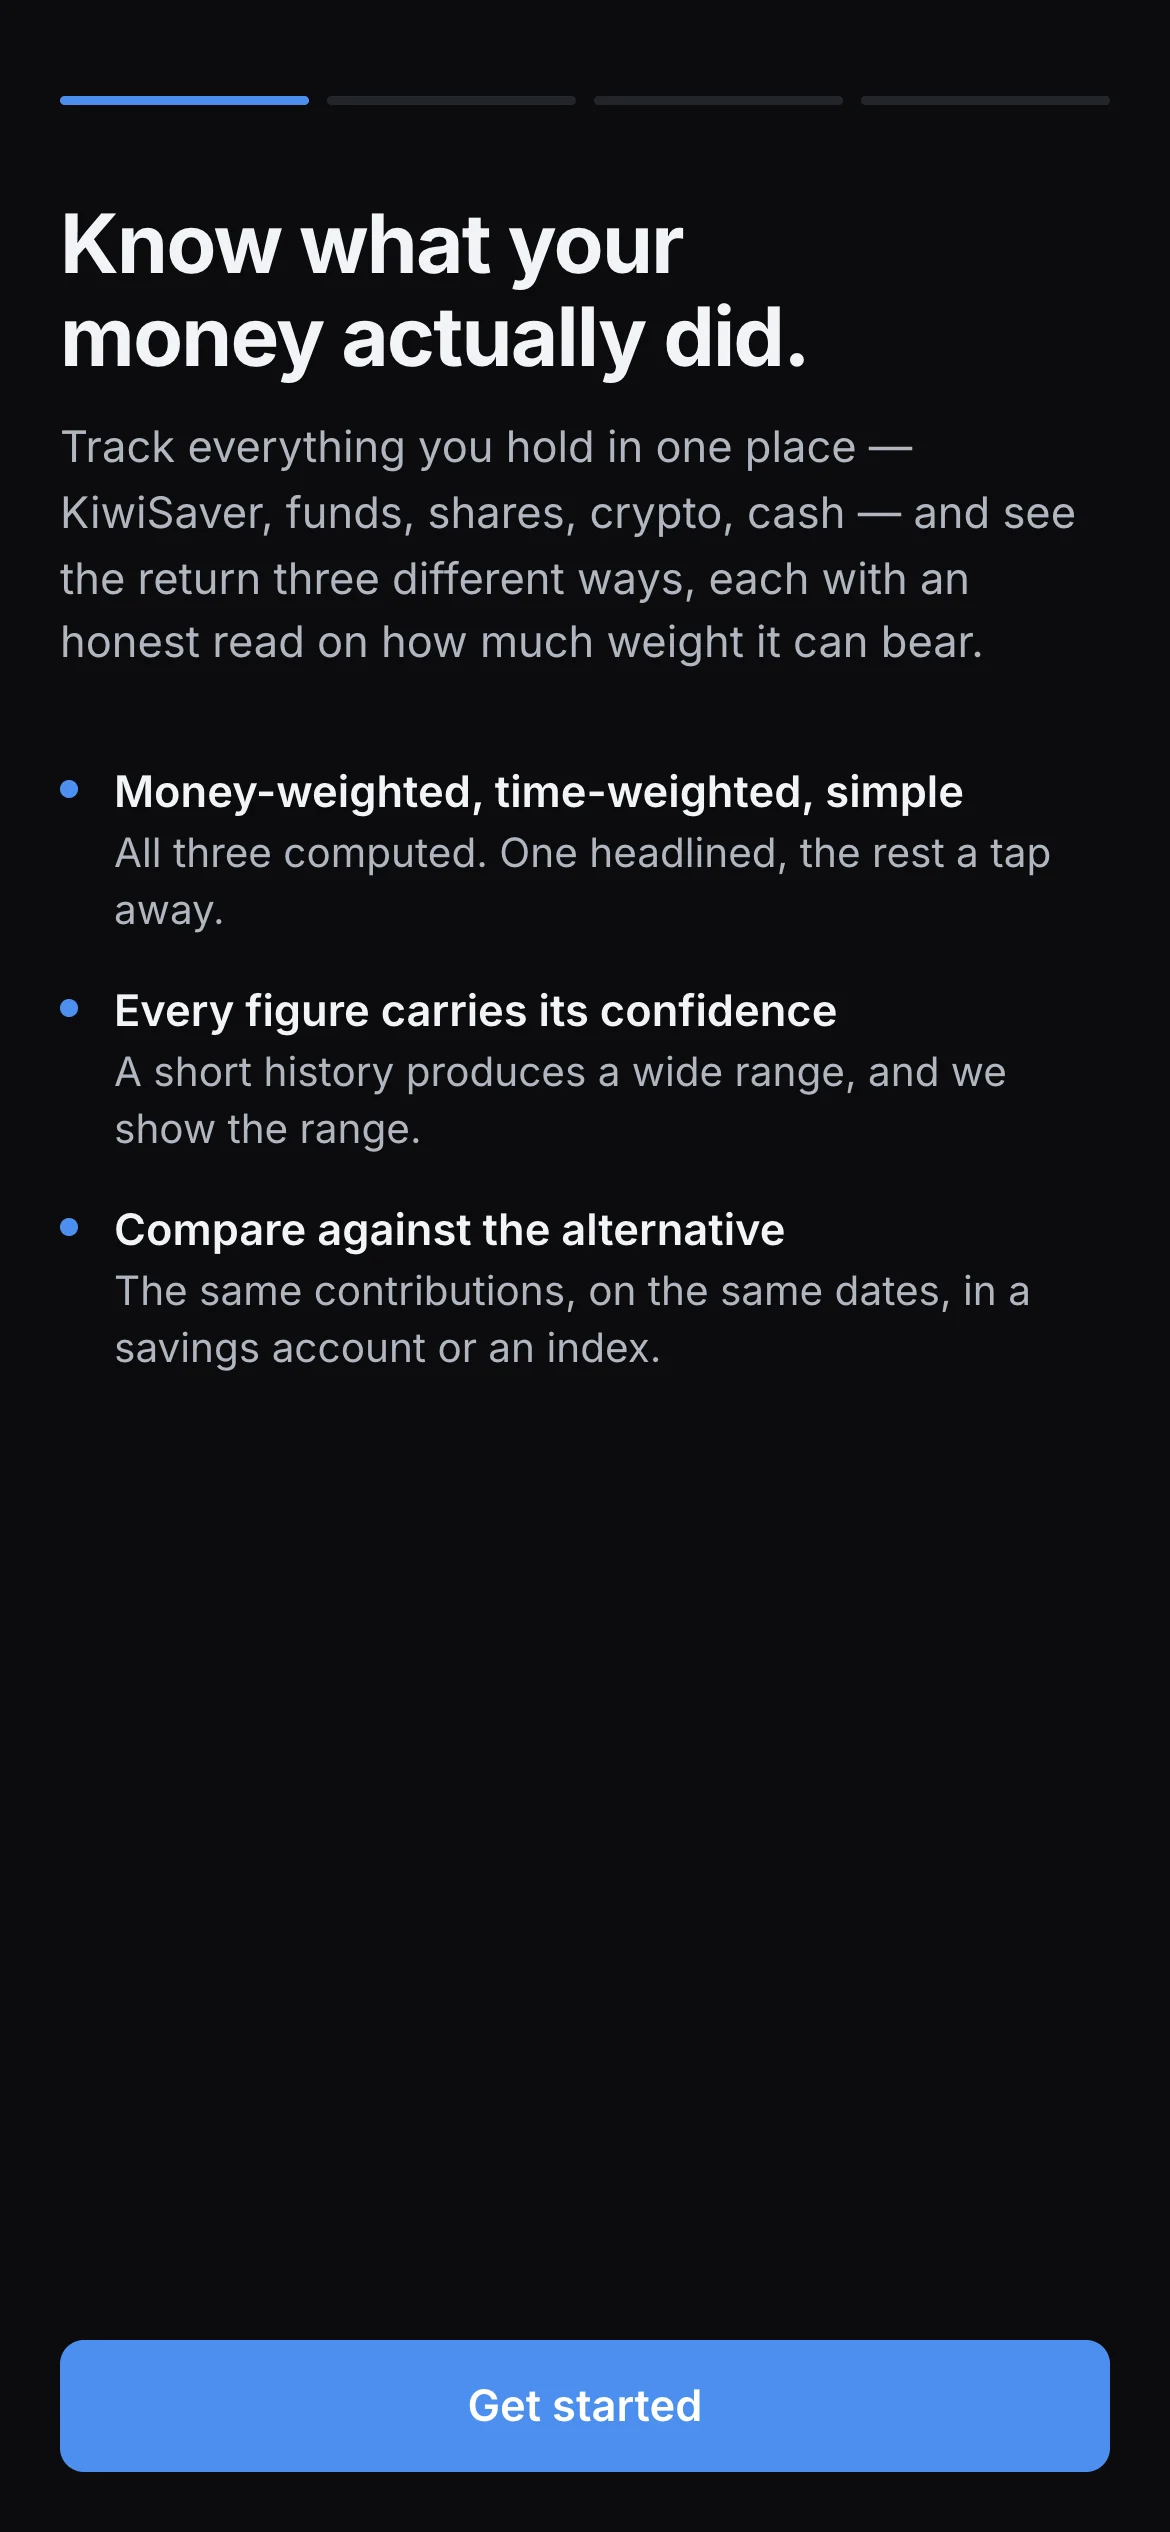
01Know what your money actually did
The promise is stated before anything is asked. Three lines, and the middle one is the honesty rule, so a user meets it before they can be surprised by it.
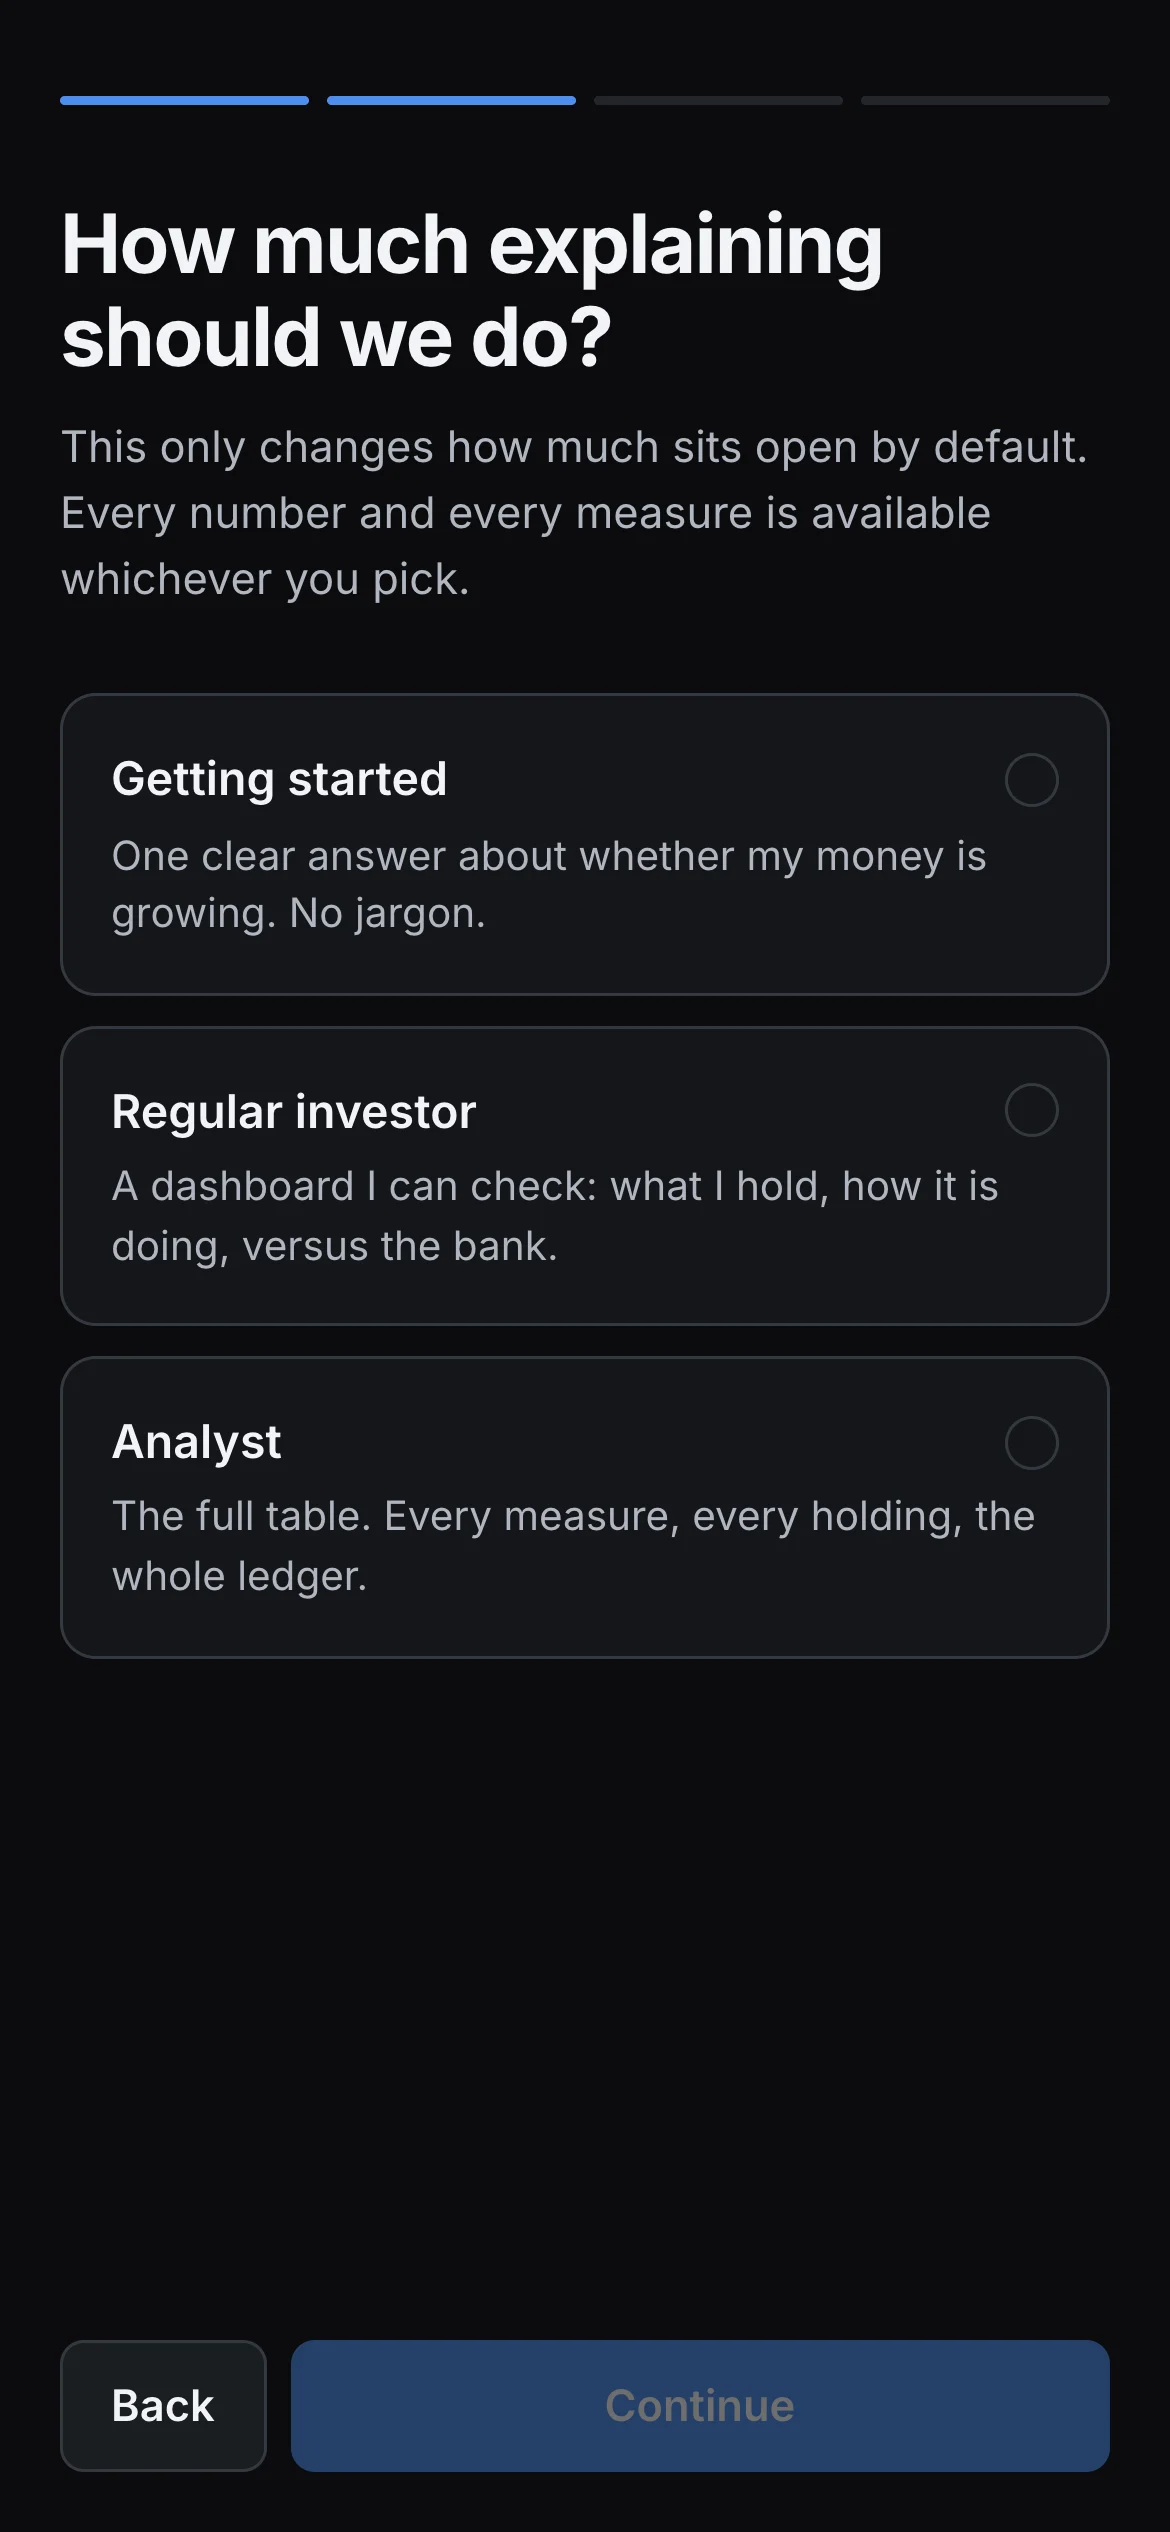
02How much explaining should we do?
Self selected, not inferred. Saying out loud that every measure stays available on every setting is what stops the choice feeling like a verdict on you.
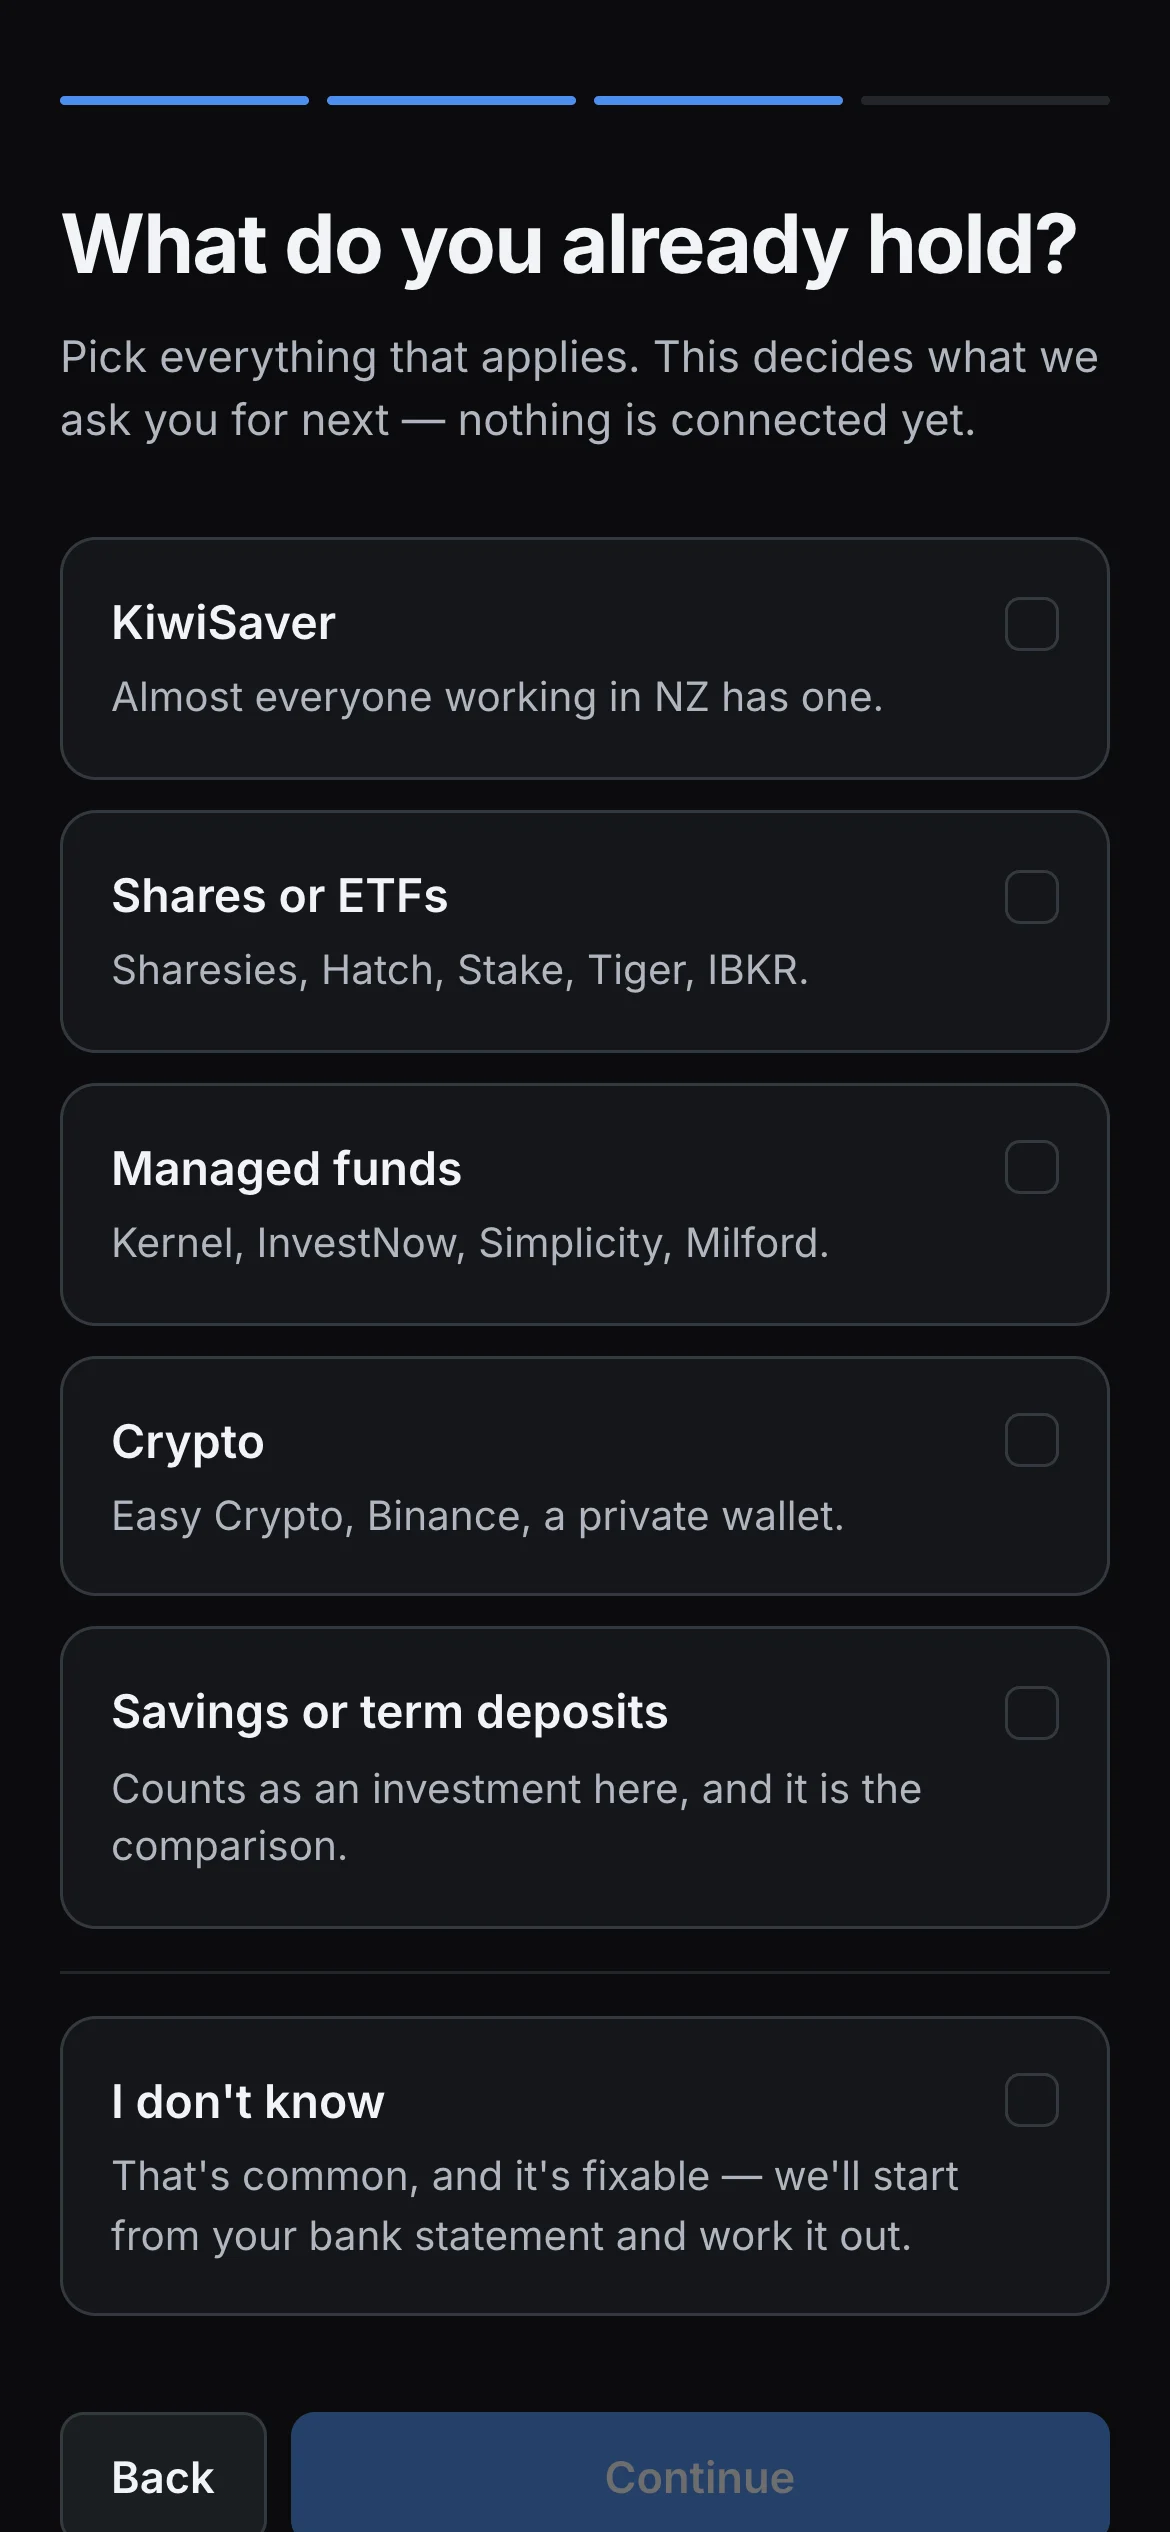
03What do you already hold?
Written in the names people use, not asset classes. Savings accounts are on the list because they become the thing everything else is measured against.
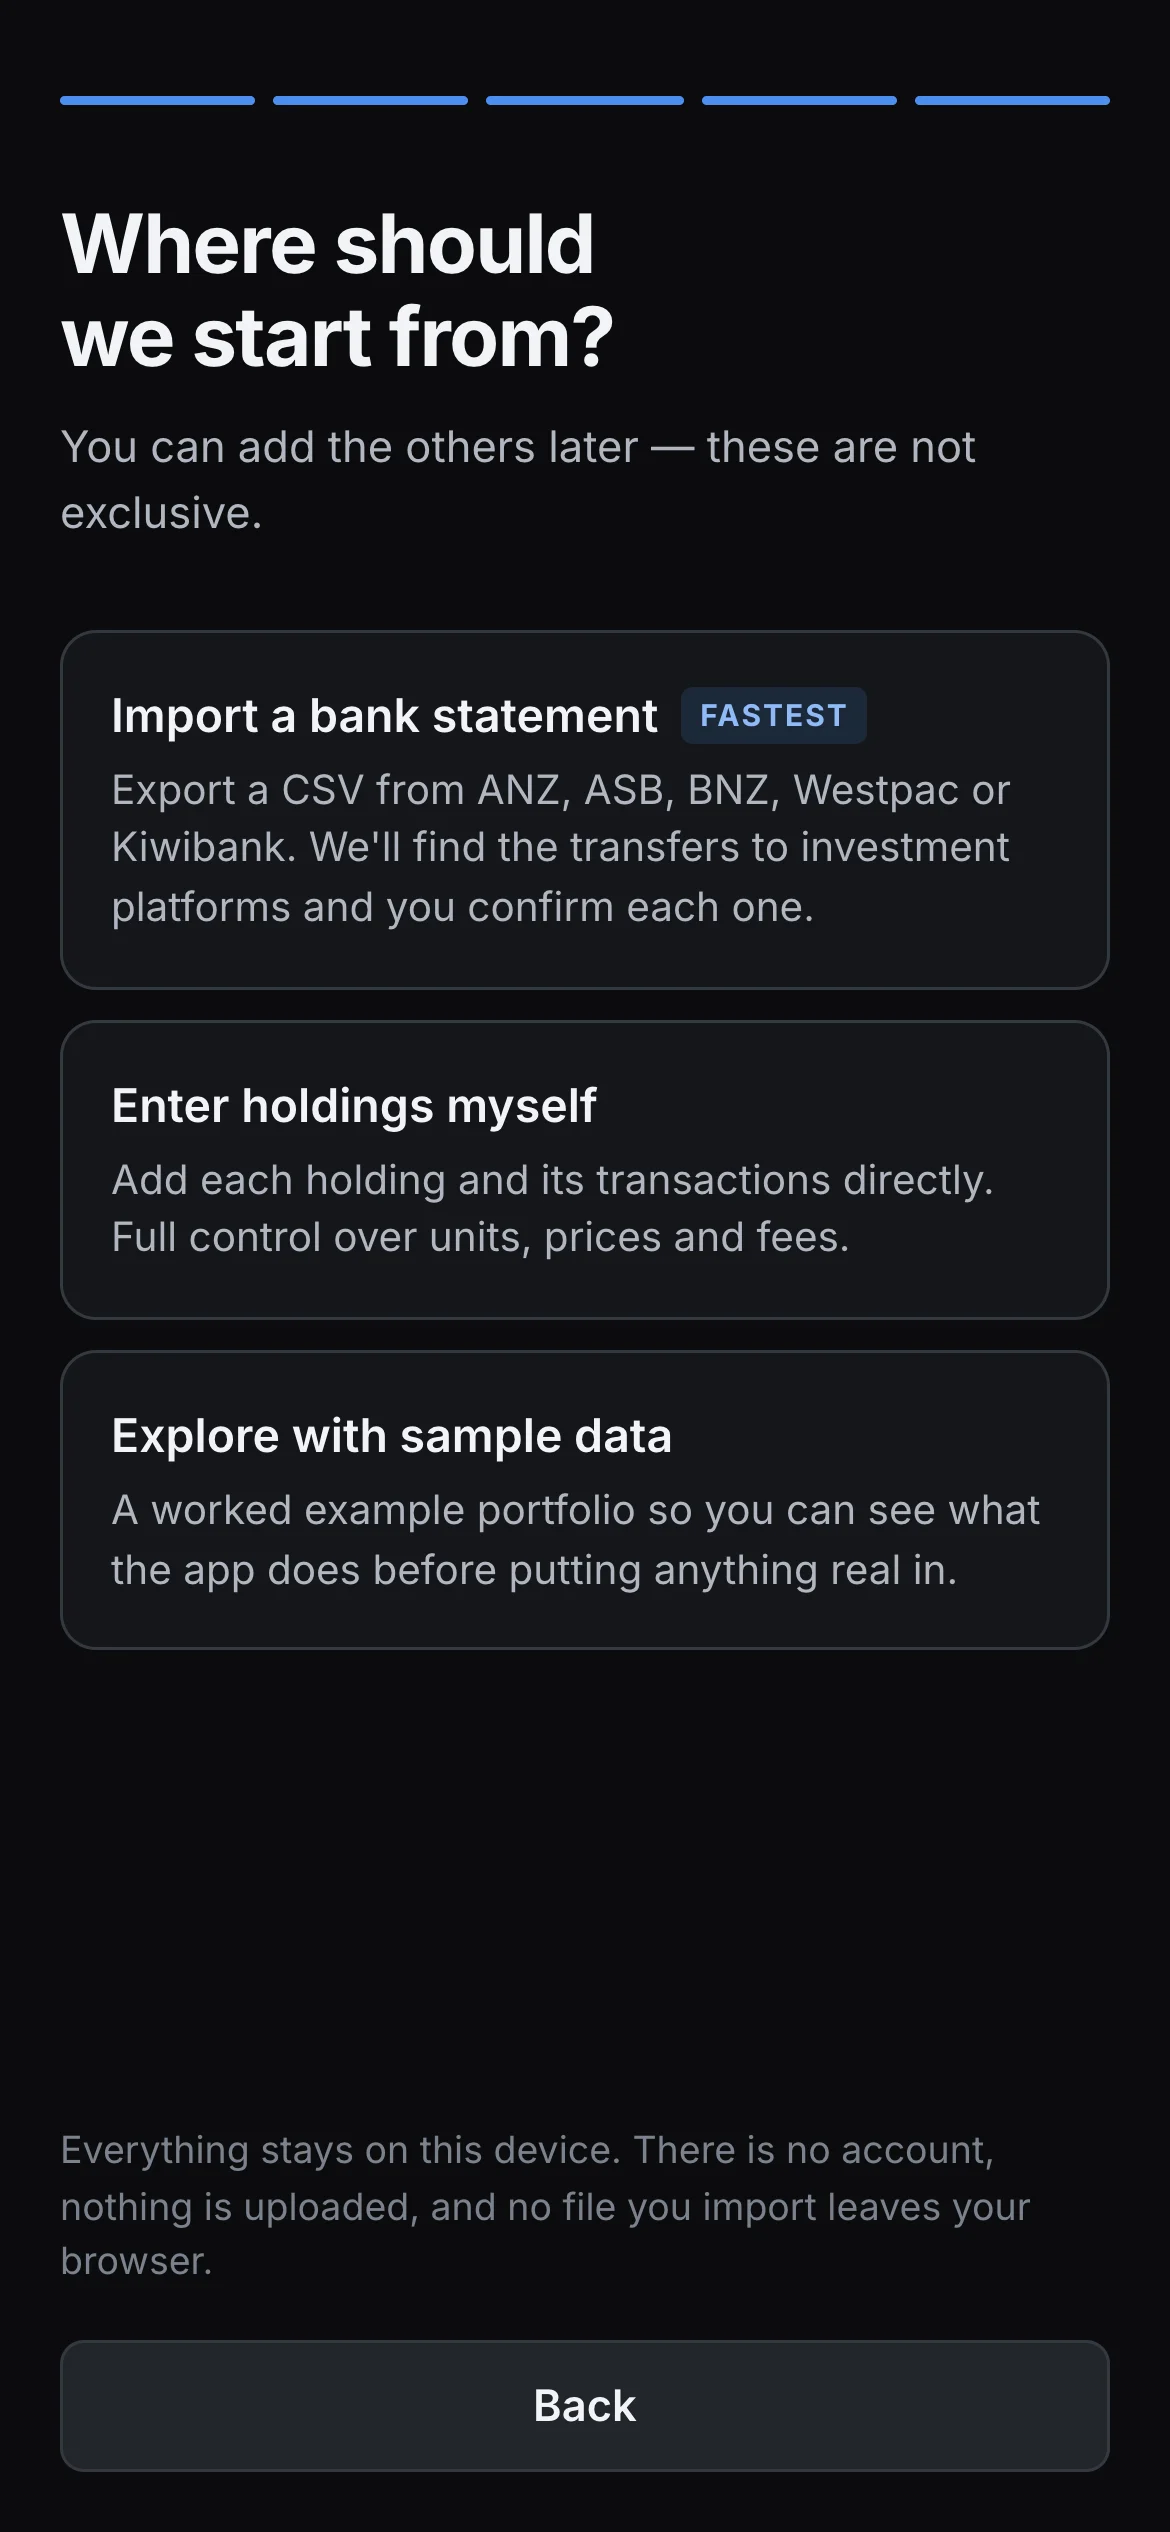
04Where should we start from?
Sample data is offered as a first class option. Someone who is not sure yet can see the whole product work before handing over a single real number.
One screen earns its place on evidence rather than taste: the KiwiSaver provider step. Bank feeds turned out to expose transactions for banks but not for investment platforms, which means some schemes can be connected and the rest have to be entered by hand. Rather than hide that, the step separates the two lists and offers I don't know as a real answer, with instructions for finding out.
The same portfolio, three ways
Identical data underneath. What changes is which question the screen is built to answer, and how much you have to know to read it.
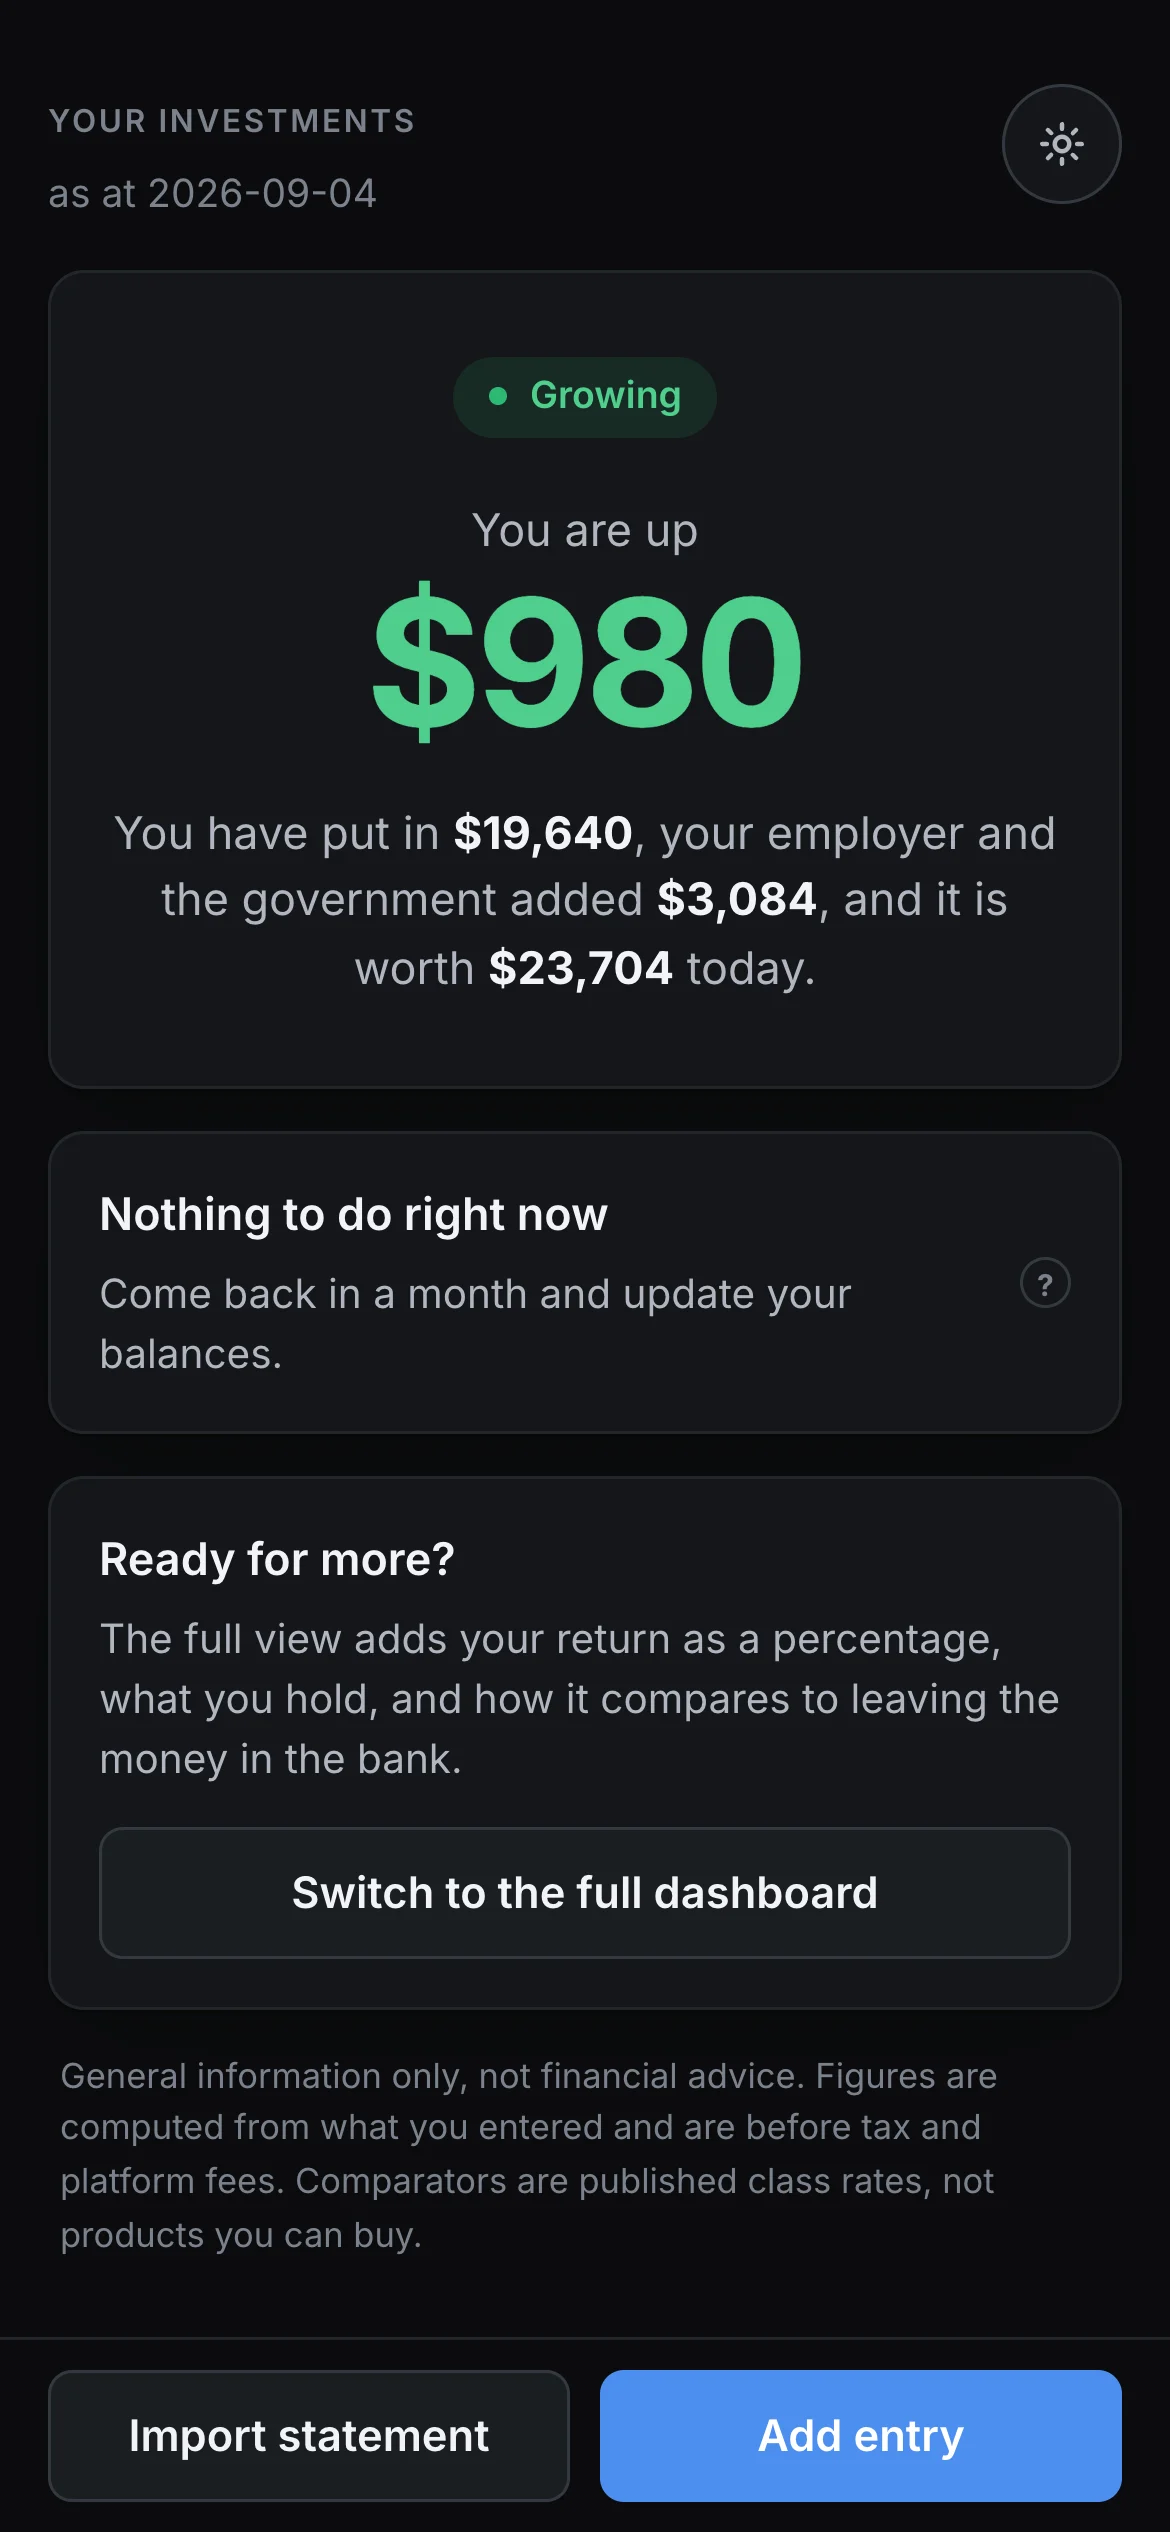
01Focus
One dollar figure, one sentence, and permission to leave. No percentage anywhere, because a percentage is the thing the audience cannot yet read.
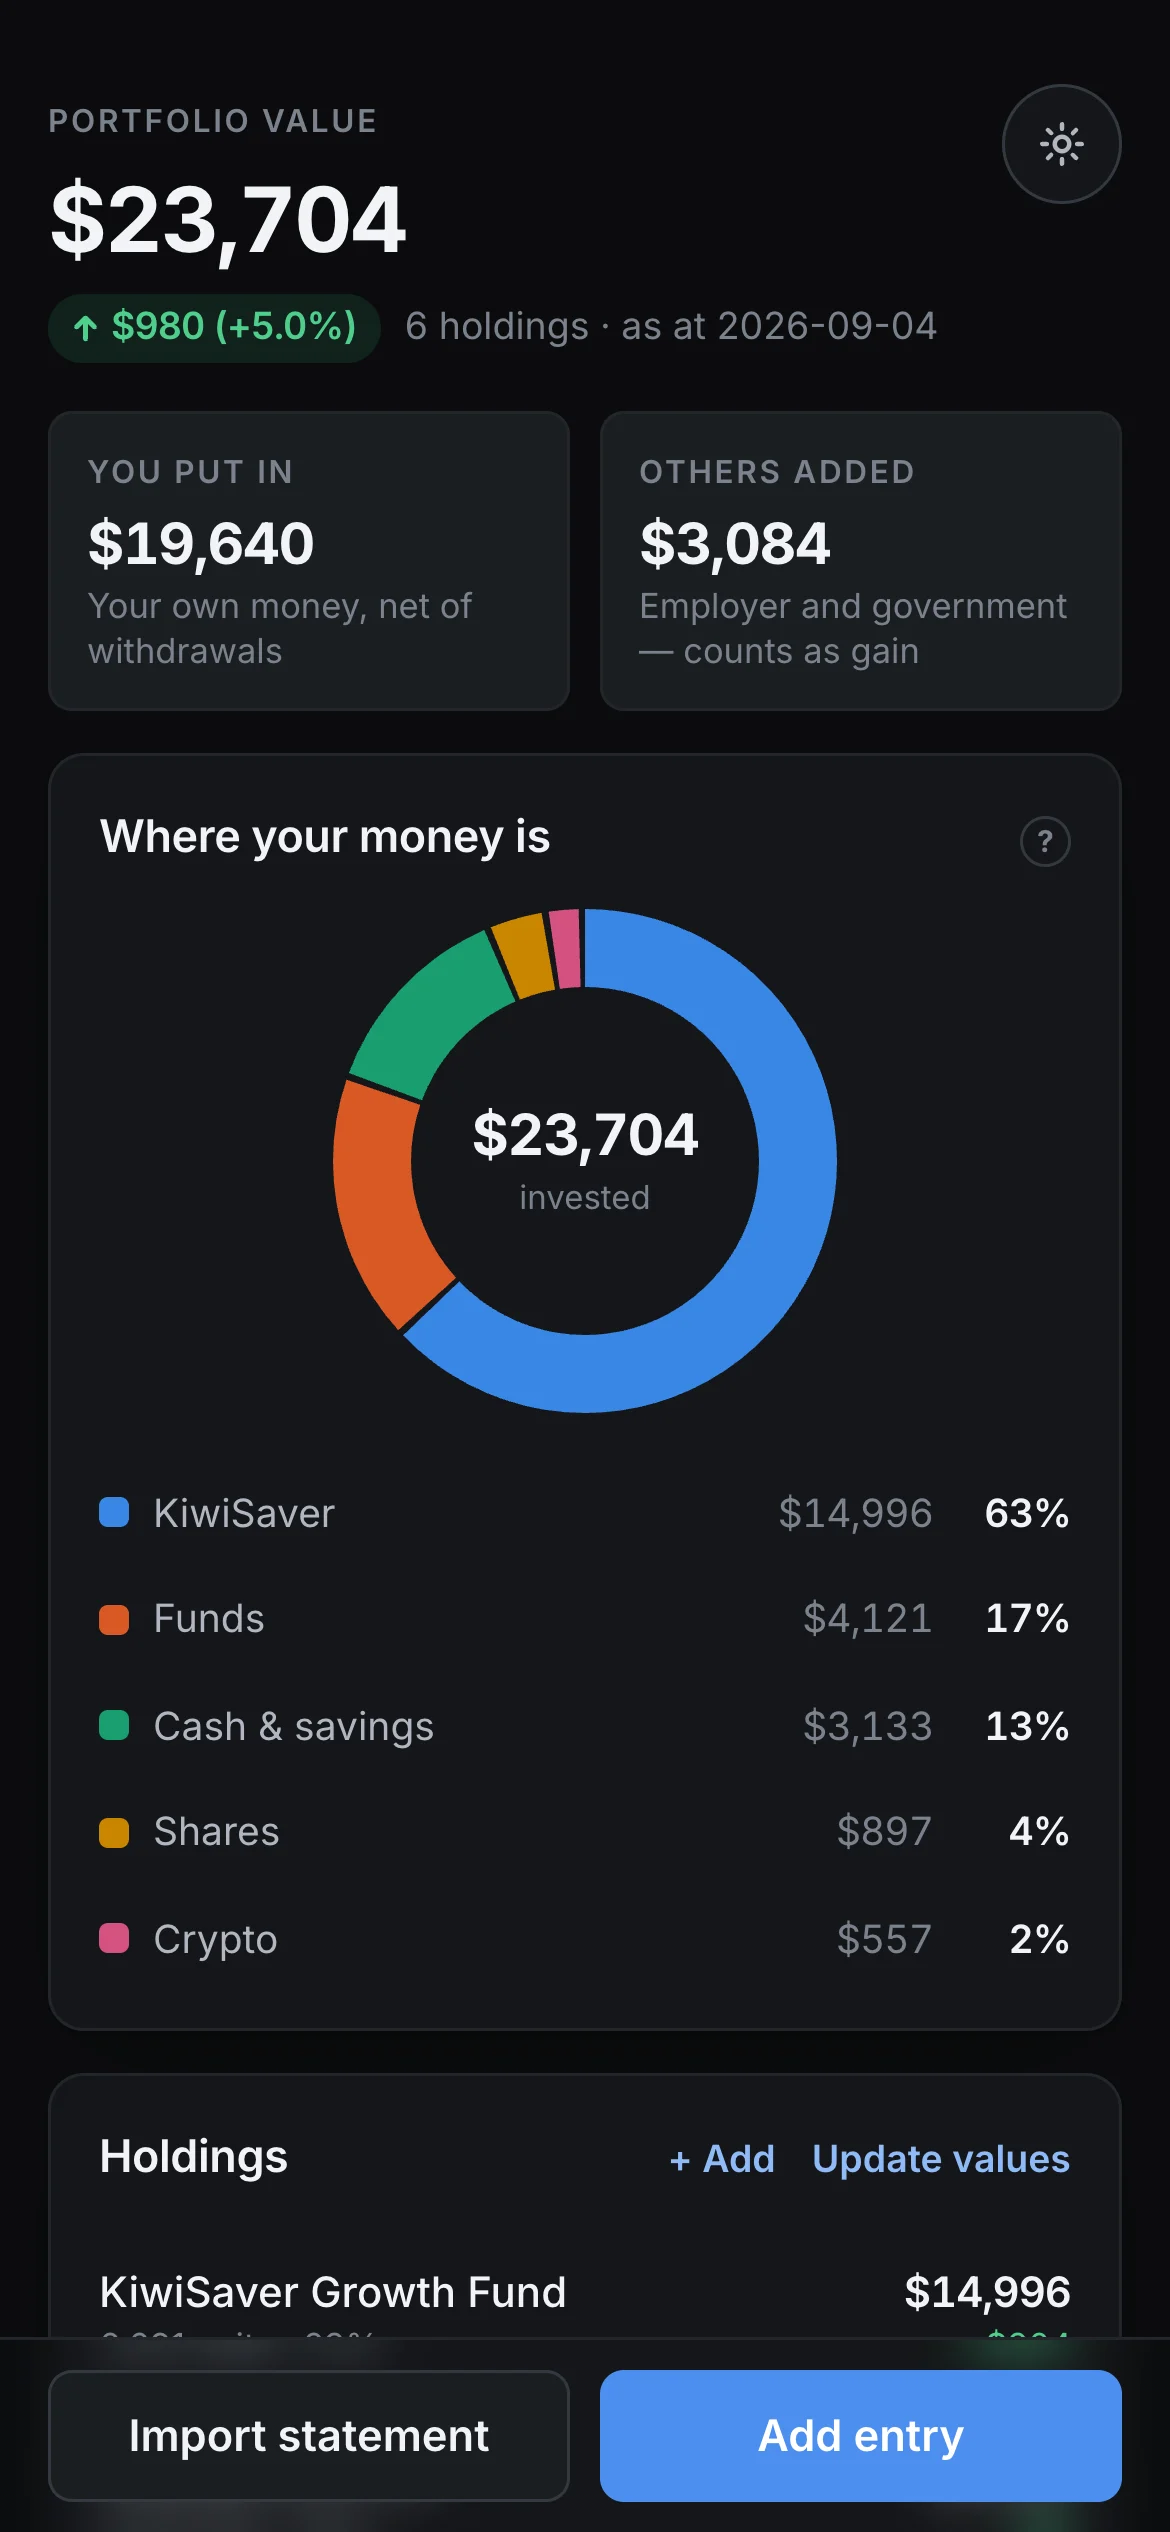
02Dashboard
A monthly check in. Money you put in is separated from money added by an employer or the government, because counting other people's contributions as your return is what makes a KiwiSaver number read like 110%.
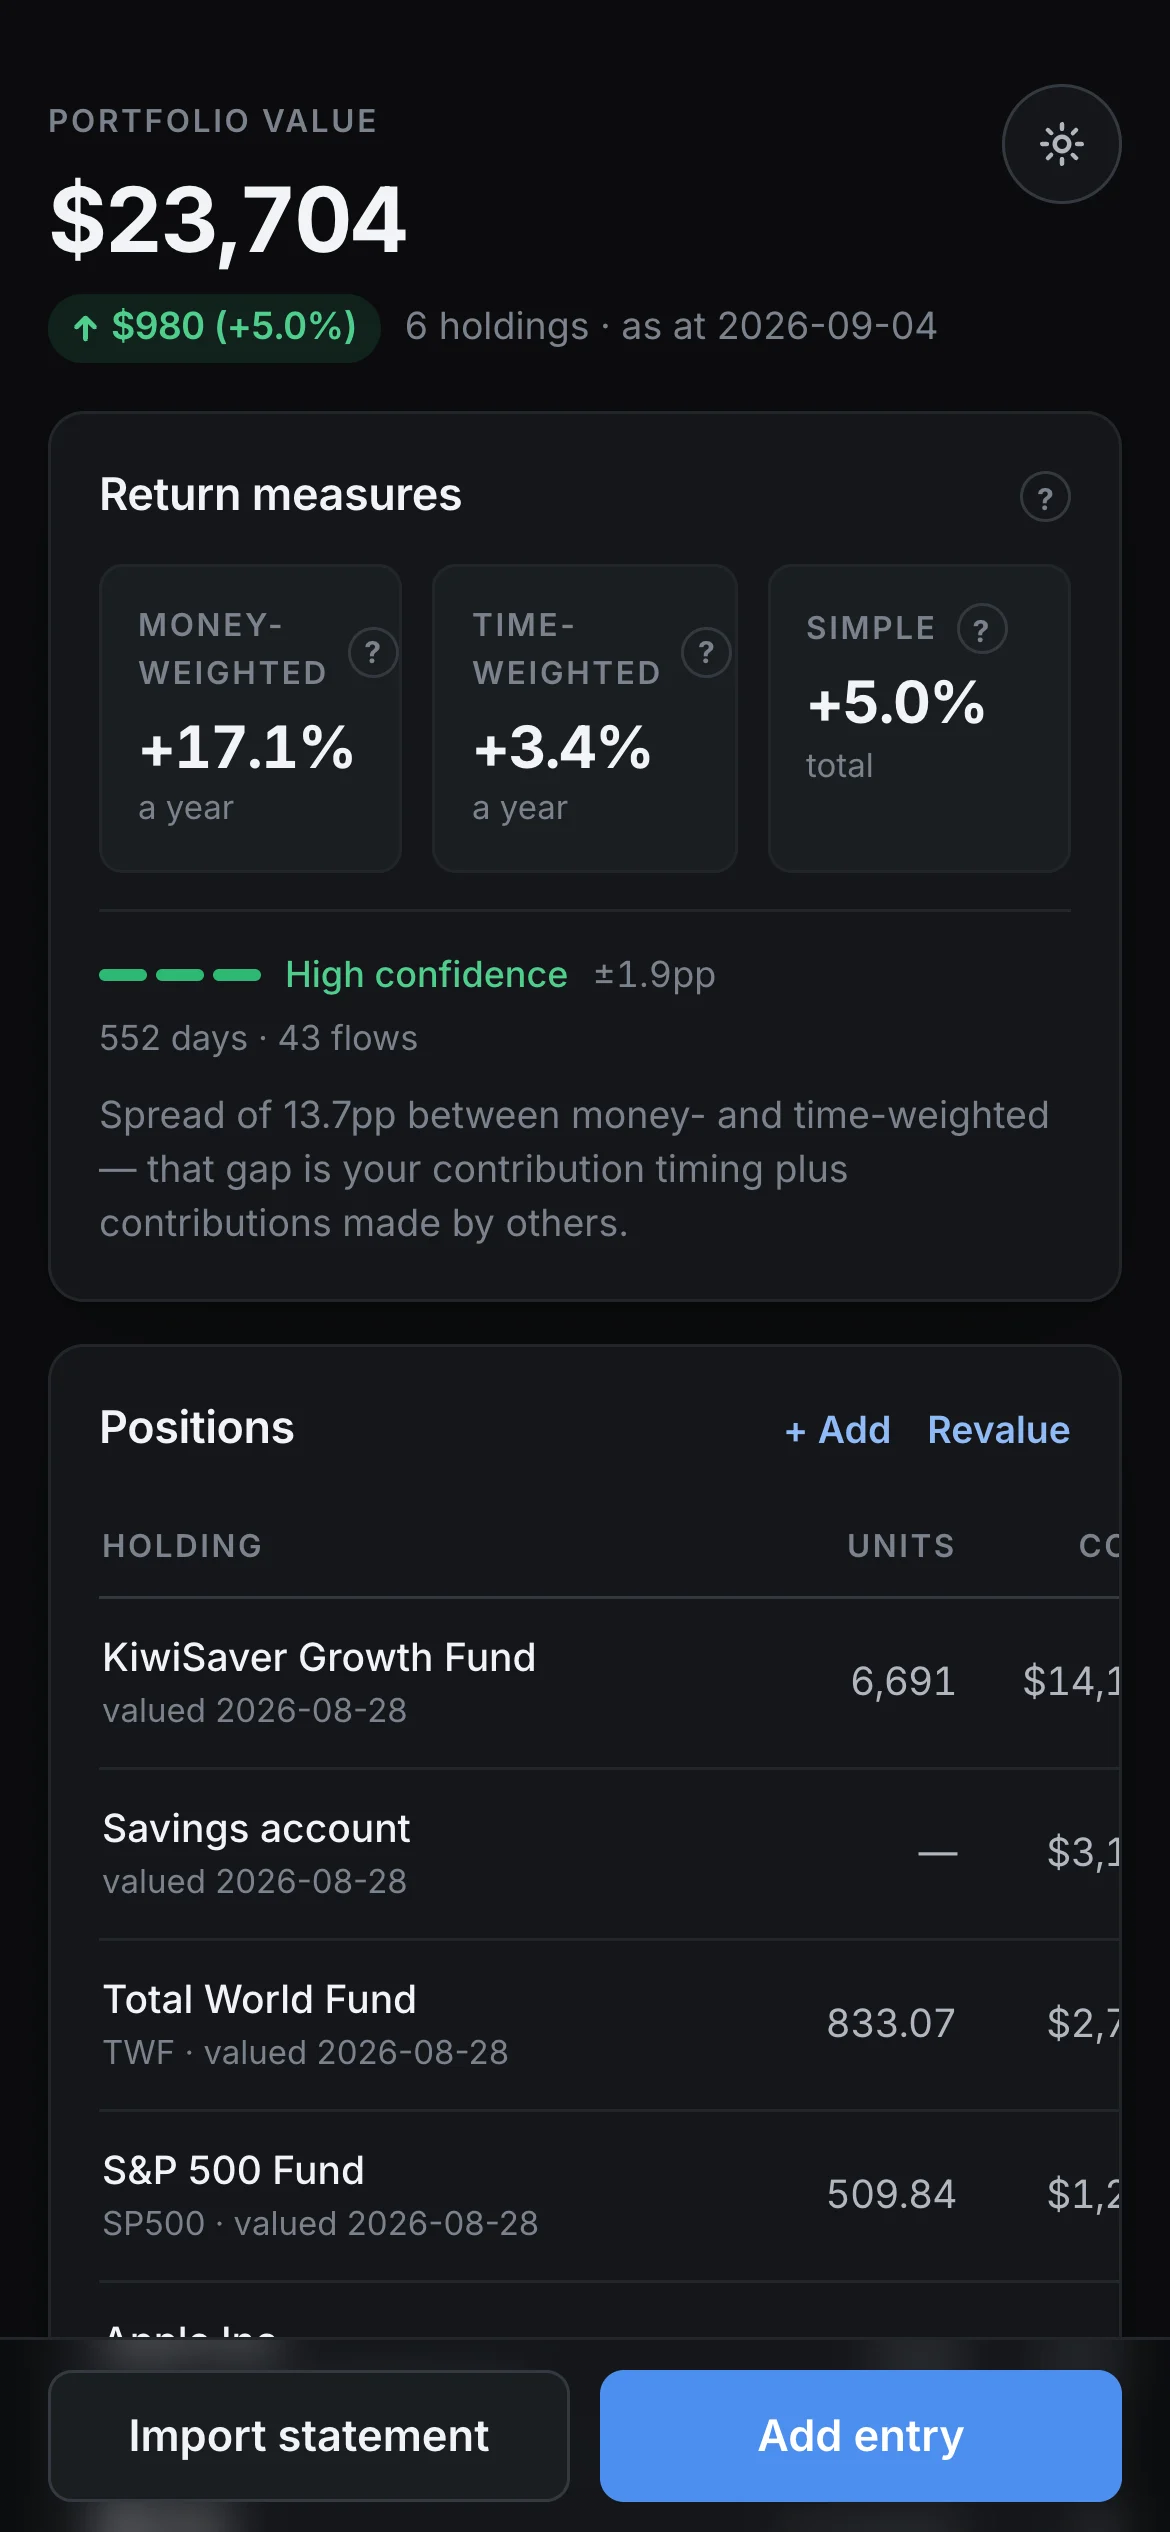
03Workbench
All three measures at once, each with its confidence band, and the gap between them explained in a sentence rather than left for the reader to interpret.
Teaching at the number, not in a tab
The literacy promise is kept in one place: wherever a figure appears that a person cannot be expected to already understand, the explanation is one tap away and written about their own money.
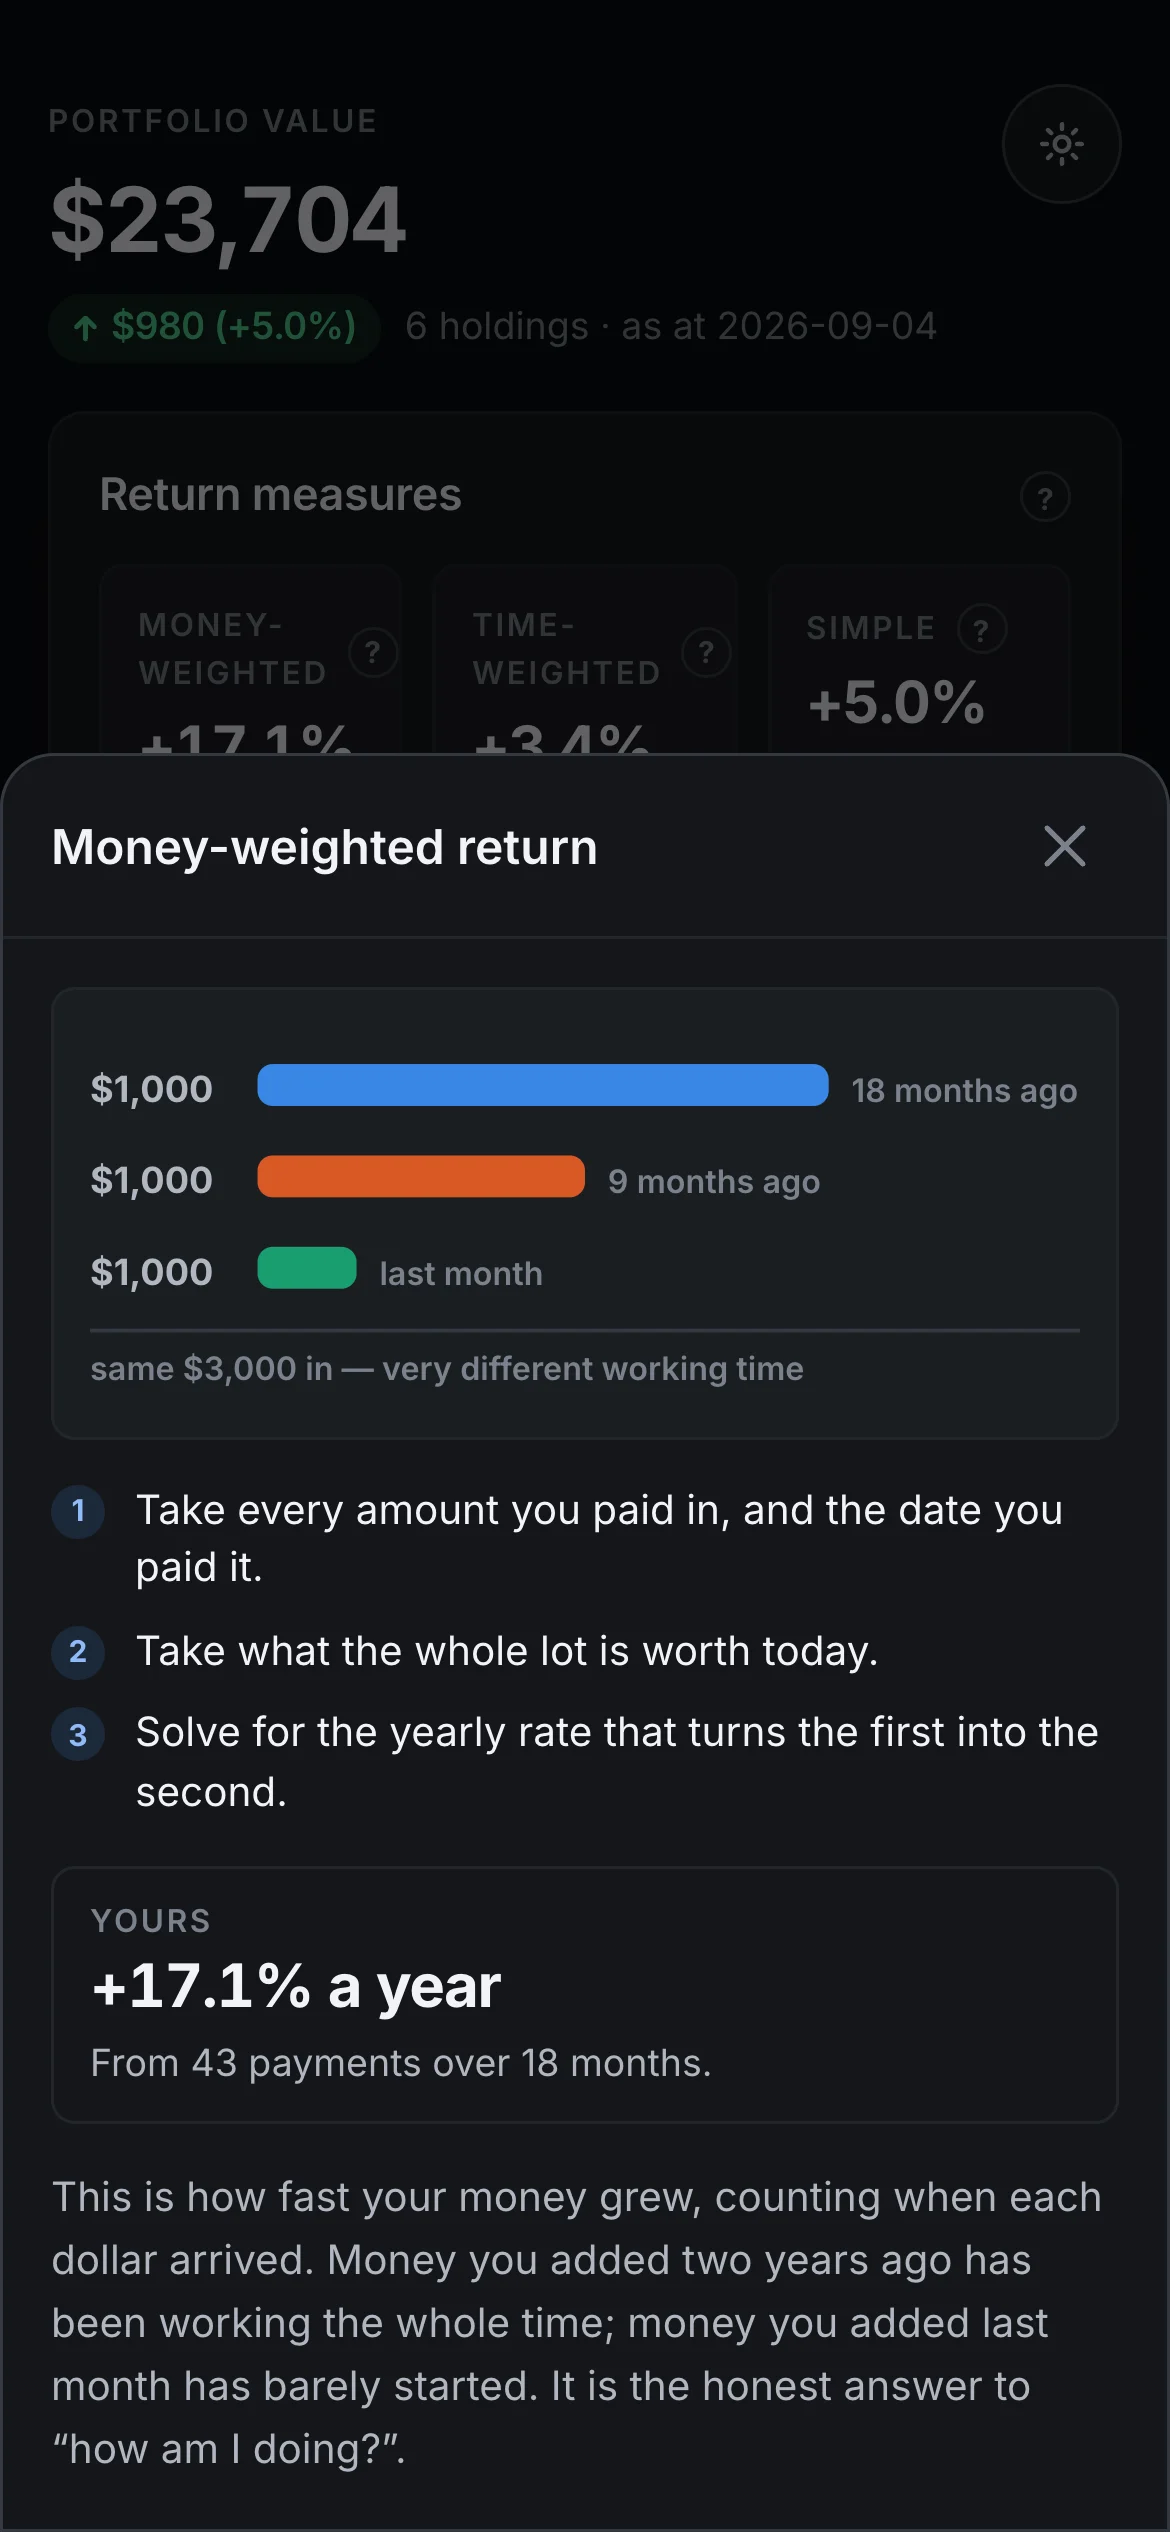
01What money-weighted return means
Explained with the user's own three deposits and how long each has been invested, then the real term as a caption. The user picks up the vocabulary without being taught it.
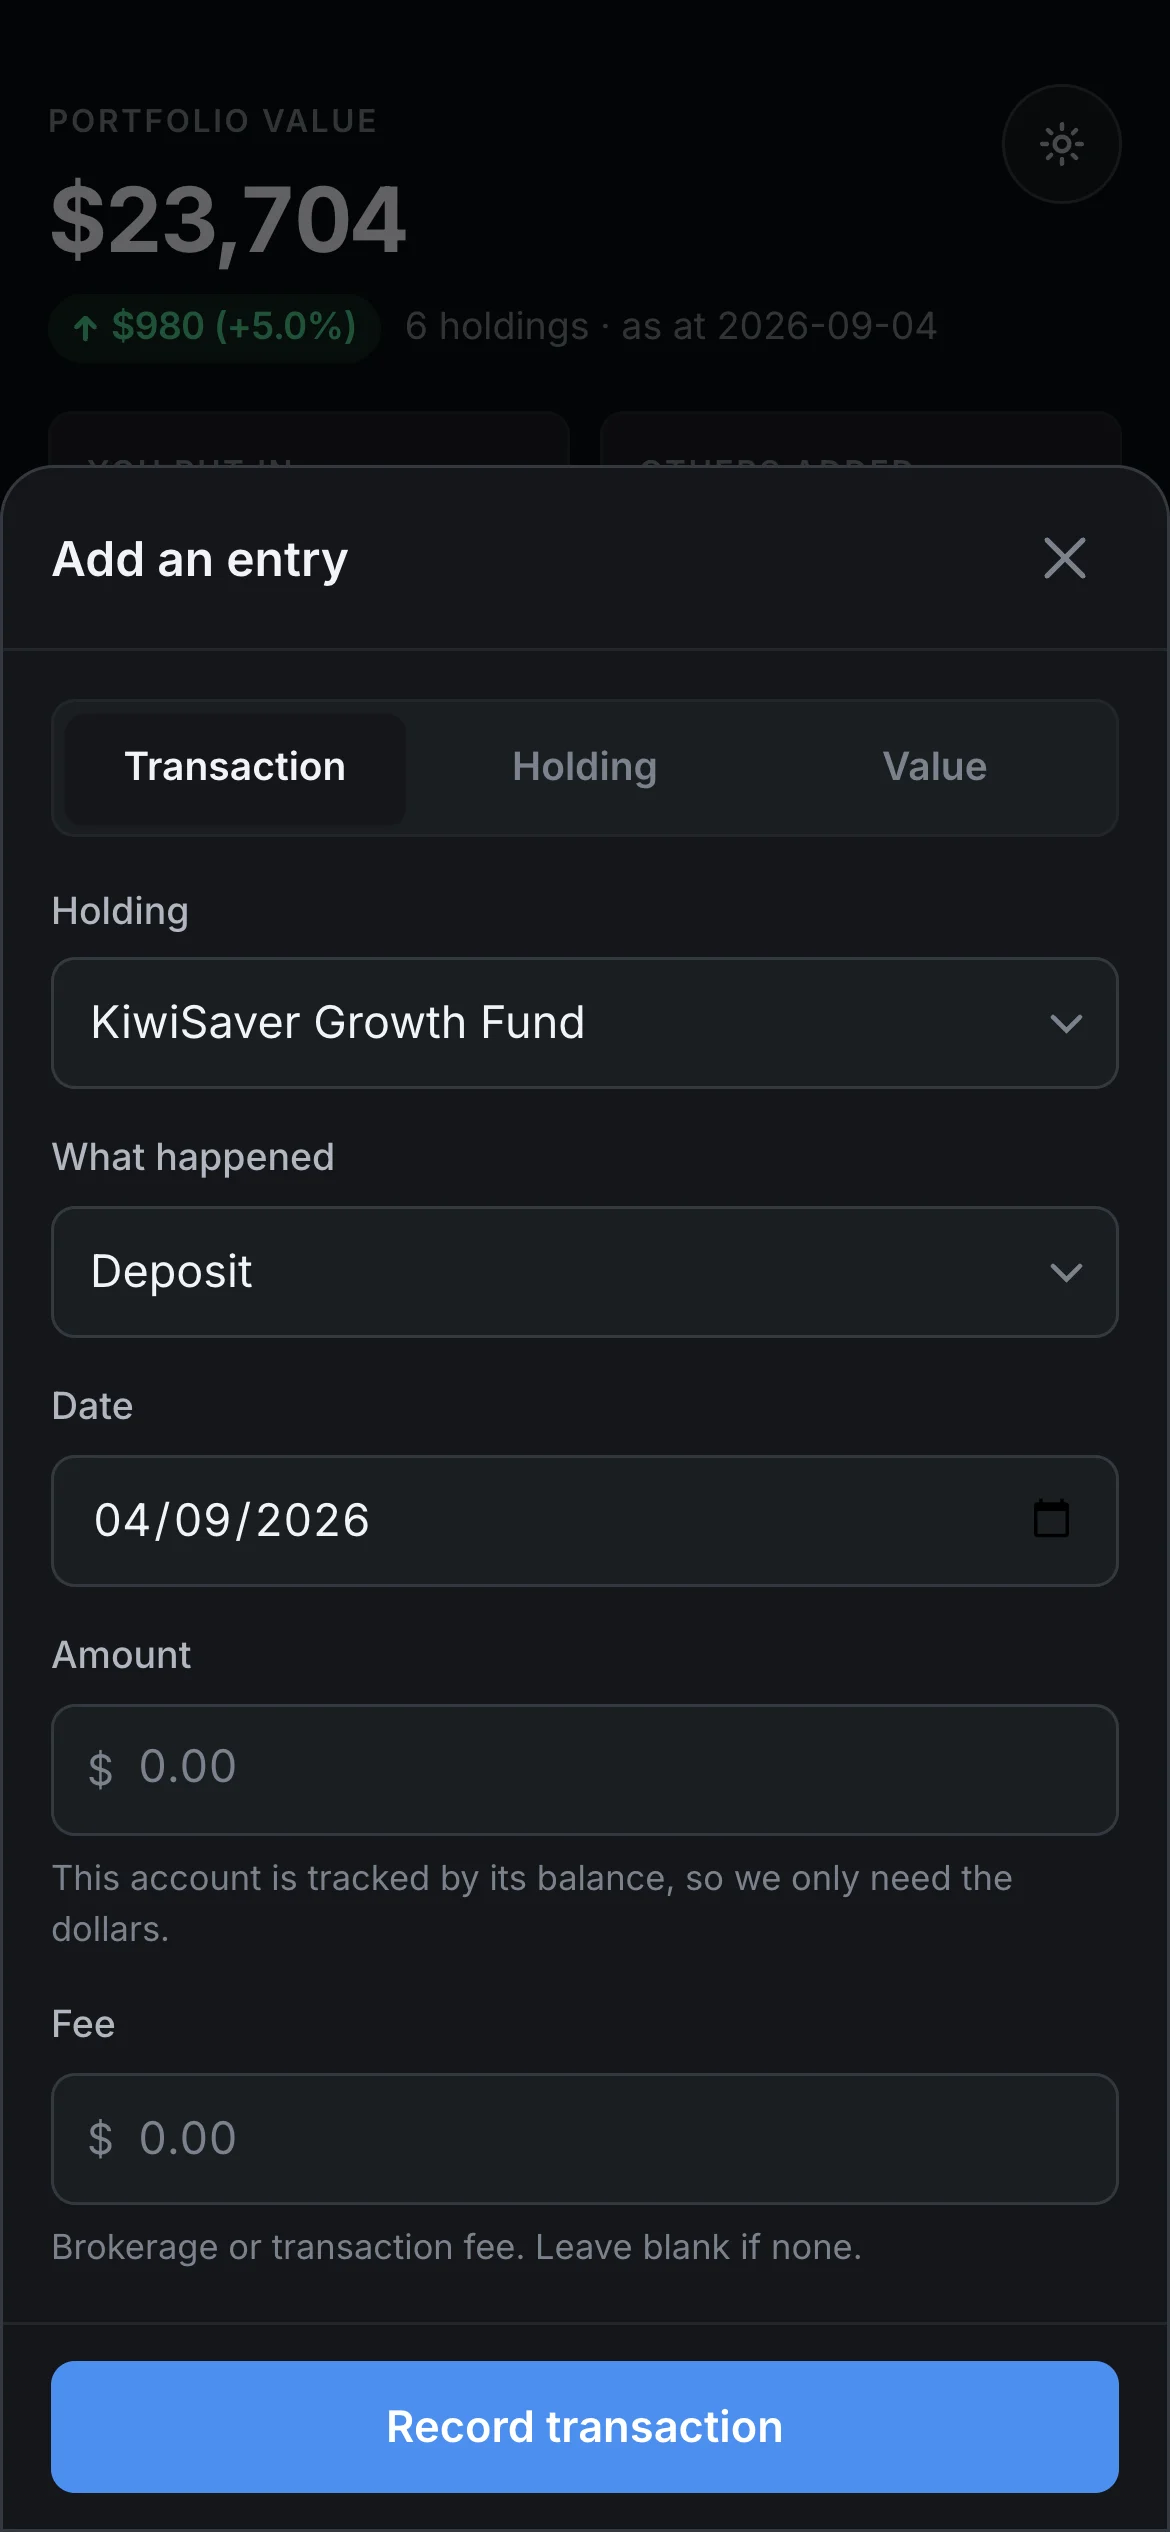
02Recording a transaction
A transaction is the only fact the user ever writes; holdings, allocation and all three returns are folded from the ledger. The form adapts to the account, so a balance tracked holding is never asked for units it doesn't have.
What happens to a number before you see it
The honesty rule is not a tone of voice, it is a step in the calculation. This is where it sits.
The fifth node is the one the spreadsheet did not have. Excel computed 11,862,233% and printed it, because nothing in the chain was allowed to say no.
- Ledger
- The append only list of every transaction. Nothing in it is ever rewritten, so an error can be corrected without quietly changing history.
- Solver
- The bit of maths that works backwards from what you paid in and what it is worth now to the yearly rate that connects them.
- Confidence band
- The range the real answer sits in, given how short the history is. A wide band is not the app being vague, it is the app being accurate about a short history.
The decisions underneath
Three things drove the architecture, and each came out of a specific failure in the reference spreadsheet.
A transaction is the only fact anyone writes
Holdings, allocation and all three returns are folded from the ledger. The spreadsheet inferred cash flows from a shifting cost figure; that inference is where its errors bred.
Other people's money is tracked separately
Employer and government contributions raise your balance without being money you supplied. Counting them as yours is what makes a KiwiSaver return read like 110%.
The solver refuses roots it cannot verify
Anything beyond ±500%, anything it can't confirm as an actual solution, and anything from too little history is reported as unknown rather than printed.
There is a regulatory line running through it too. In New Zealand, financial advice is defined by what a service does, not by what it is labelled, because a disclaimer doesn't put you outside the regime. So the comparison feature is constrained by design. The user picks what to compare against and the app never picks for them. The rates are published class averages, and no bank or fund is ever named.
Where it stands
A live prototype, built and deployed. The thesis from that lunchtime conversation held up under verification. The tools people already use will confidently tell them something false, and the people least able to catch it are the ones most likely to be relying on them.
Three people have used it so far, two friends and my younger brother. Enough to watch someone read a confidence band for the first time, not enough to call it validated. What I want to know next is whether being told a number is uncertain reads as honesty, or as the app being unsure of itself. What I would test next is whether the honesty rule survives contact with users, or whether being told a number is uncertain reads as the app being unsure of itself.
Open the prototype ↗